Grundlæggende statistik
| Institutionelle aktier (lange) | 74.458.172 - 68,99% (ex 13D/G) - change of 1,48MM shares 2,11% MRQ |
| Institutionel værdi (lang) | $ 7.490.019 USD ($1000) |
Institutionelt ejerskab og aktionærer
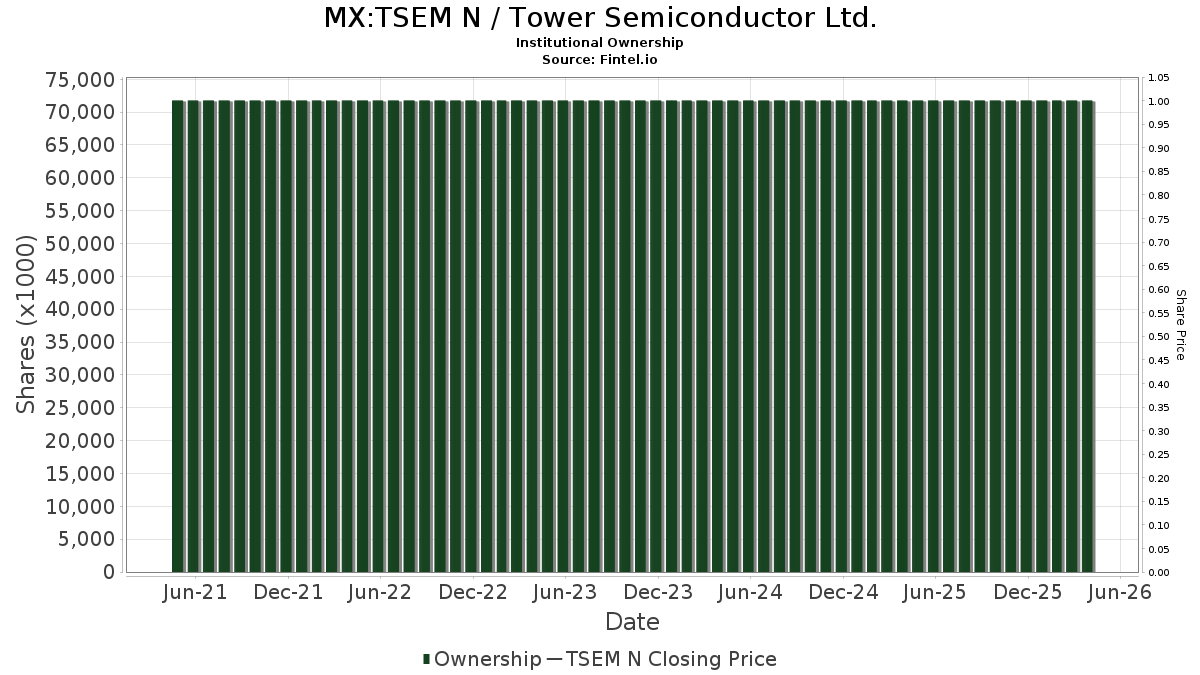
Tower Semiconductor Ltd. (MX:TSEM N) har 340 institutionelle ejere og aktionærer, der har indsendt 13D/G- eller 13F-formularer til Securities Exchange Commission (SEC). Disse institutioner har i alt 74,458,172 aktier. Største aktionærer omfatter Clal Insurance Enterprises Holdings Ltd, Price T Rowe Associates Inc /md/, Vanguard Group Inc, Senvest Management, LLC, BlackRock, Inc., Phoenix Holdings Ltd., Migdal Insurance & Financial Holdings Ltd., Harel Insurance Investments & Financial Services Ltd., Goldman Sachs Group Inc, and Capital International Investors .
Tower Semiconductor Ltd. (BMV:TSEM N) institutionel ejerskabsstruktur viser aktuelle positioner i virksomheden efter institutioner og fonde, samt seneste ændringer i positionsstørrelse. Større aktionærer kan omfatte individuelle investorer, investeringsforeninger, hedgefonde eller institutioner. Skema 13D angiver, at investoren besidder (eller besidder) mere end 5 % af virksomheden og har til hensigt (eller har til hensigt at) aktivt at forfølge en ændring i forretningsstrategi. Skema 13G indikerer en passiv investering på over 5%.
Fondens stemningsscore
Fund Sentiment Score (fka Ownership Accumulation Score) finder de aktier, der bliver mest købt af fonde. Det er resultatet af en sofistikeret, multi-faktor kvantitativ model, der identificerer virksomheder med de højeste niveauer af institutionel akkumulering. Scoringsmodellen bruger en kombination af den samlede stigning i oplyste ejere, ændringerne i porteføljeallokeringer i disse ejere og andre målinger. Tallet går fra 0 til 100, hvor højere tal indikerer et højere niveau af akkumulering for sine jævnaldrende, og 50 er gennemsnittet.
Opdateringsfrekvens: Dagligt
Se Ownership Explorer, som giver en liste over højest rangerende virksomheder.
AI+ Ask Fintel’s AI assistant about Tower Semiconductor Ltd..
Select a question to share a public post with an AI-crafted answer.
Thinking of good questions…
13F og NPORT arkivering
Detaljer om 13F-arkivering er gratis. Detaljer om NP-ansøgninger kræver et premium-medlemskab. Grønne rækker angiver nye positioner. Røde rækker angiver lukkede positioner. Klik på linket ikon for at se den fulde transaktionshistorik.
Opgrader
for at låse premium-data op og eksportere til Excel ![]() .
.
| Fil dato | Kilde | Investor | Type | Gennemsnitlig pris (Øst) |
Aktier | Δ Aktier (%) |
Rapporteret Værdi ($1000) |
Δ Værdi (%) |
Port Alloc (%) |
|
|---|---|---|---|---|---|---|---|---|---|---|
| 2026-02-11 | 13F | Franklin Resources Inc | 185.023 | 21.725 | ||||||
| 2026-02-10 | 13F | Quantbot Technologies LP | 5.632 | 661 | ||||||
| 2026-02-10 | 13F | Goldman Sachs Group Inc | 2.206.467 | 214,74 | 259.083 | 411,16 | ||||
| 2026-02-17 | 13F | Aqr Capital Management Llc | 29.251 | 3.424 | ||||||
| 2026-04-22 | 13F | Spire Wealth Management | 280 | 10,24 | 49 | 68,97 | ||||
| 2026-02-12 | 13F | Commonwealth Equity Services, Llc | 7.460 | -5,06 | 876 | |||||
| 2026-02-11 | 13F | ARK Investment Management LLC | 27.598 | -30,37 | 3.241 | 13,09 | ||||
| 2026-02-18 | 13F | Vident Advisory, LLC | 5.616 | -16,15 | 659 | 36,16 | ||||
| 2026-02-13 | 13F | Dockside LLC | 8.357 | 981 | ||||||
| 2026-02-13 | 13F | Mml Investors Services, Llc | 3.358 | 394 | ||||||
| 2025-11-24 | 13F | Greenfield Seitz Capital Management, LLC | 0 | -100,00 | 0 | -100,00 | ||||
| 2026-02-17 | 13F | Paloma Partners Management Co | 0 | -100,00 | 0 | |||||
| 2025-11-06 | 13F | Advisors Asset Management, Inc. | 0 | -100,00 | 0 | |||||
| 2026-01-29 | 13F | Vanguard Group Inc | 4.338.080 | 1,24 | 507.317 | 65,99 | ||||
| 2026-02-09 | 13F | Geode Capital Management, Llc | 92.980 | -4,35 | 10.918 | 55,34 | ||||
| 2026-02-17 | 13F | Massar Capital Management, LP | 13.334 | 1.566 | ||||||
| 2026-02-17 | 13F | State Of Wisconsin Investment Board | 2.869 | 336 | ||||||
| 2026-02-17 | 13F | Credit Agricole S A | 282.144 | 15,79 | 33.129 | 88,05 | ||||
| 2026-02-12 | 13F | Granite Investment Partners, LLC | 108.627 | -65,81 | 12.755 | -44,48 | ||||
| 2025-11-14 | 13F | Gts Securities Llc | 0 | -100,00 | 0 | -100,00 | ||||
| 2026-04-23 | 13F | Oppenheimer Asset Management Inc. | 2.454 | -44,63 | 431 | -17,31 | ||||
| 2026-02-11 | 13F | O'shaughnessy Asset Management, Llc | 2.059 | 242 | ||||||
| 2026-01-27 | 13F | Hennessy Advisors Inc | 0 | -100,00 | 0 | |||||
| 2026-02-12 | 13F | DRW Securities, LLC | 2.206 | 259 | ||||||
| 2026-02-17 | 13F | Stokes Family Office, LLC | 2.024 | 238 | ||||||
| 2026-02-17 | 13F | Jones Financial Companies Lllp | 898 | 6,40 | 105 | 84,21 | ||||
| 2025-10-27 | 13F | First Horizon Corp | 0 | -100,00 | 0 | |||||
| 2026-04-08 | 13F | Canandaigua National Corp | 1.179 | 201 | ||||||
| 2026-02-17 | 13F | Trexquant Investment LP | 70.978 | 8.334 | ||||||
| 2026-02-12 | 13F | EAM Investors, LLC | 28.578 | -51,89 | 3.356 | -21,87 | ||||
| 2026-02-17 | 13F | Tudor Investment Corp Et Al | Call | 42.200 | 1.218,75 | 4.955 | 2.045,02 | |||
| 2026-02-17 | 13F | Tudor Investment Corp Et Al | Put | 33.600 | 3.945 | |||||
| 2026-04-24 | 13F | Root Financial Partners, LLC | 3 | 1 | ||||||
| 2026-02-10 | 13F | Argent Trust Co | 0 | -100,00 | 0 | |||||
| 2026-02-17 | 13F | Amundi | 19.827 | 50,49 | 2.328 | 139,51 | ||||
| 2026-02-17 | 13F | Northern Trust Corp | 53.943 | -58,43 | 6.334 | -32,49 | ||||
| 2026-04-14 | 13F | Seven Mile Advisory | 1.339 | 235 | ||||||
| 2026-02-06 | 13F | Vestmark Advisory Solutions, Inc. | 27.192 | 3.193 | ||||||
| 2026-02-17 | 13F | Polar Capital Holdings Plc | 62.559 | 7.346 | ||||||
| 2026-04-23 | 13F | J.w. Cole Advisors, Inc. | 12.120 | 2.127 | ||||||
| 2025-11-14 | 13F | Maverick Capital Ltd | 0 | -100,00 | 0 | -100,00 | ||||
| 2026-01-23 | 13F | Assetmark, Inc | 3.229 | 12.816,00 | 379 | 37.800,00 | ||||
| 2026-02-11 | 13F | Jpmorgan Chase & Co | 136.876 | 126,70 | 16.072 | 268,18 | ||||
| 2026-02-11 | 13F | Jpmorgan Chase & Co | Call | 3.900 | 458 | |||||
| 2026-02-06 | 13F | Pnc Financial Services Group, Inc. | 7.500 | -8,54 | 881 | 48,65 | ||||
| 2026-02-11 | 13F | Group One Trading, L.p. | Put | 147.500 | 175,19 | 17.319 | 346,94 | |||
| 2026-02-13 | 13F | Boston Partners | 12.835 | -94,50 | 1.507 | -91,07 | ||||
| 2026-02-11 | 13F | Group One Trading, L.p. | Call | 198.700 | 18,77 | 23.331 | 92,90 | |||
| 2025-11-14 | 13F | ExodusPoint Capital Management, LP | 112.238 | 8.115 | ||||||
| 2026-02-13 | 13F | JustInvest LLC | 21.909 | -3,97 | 2.573 | 55,97 | ||||
| 2026-02-11 | 13F | TCTC Holdings, LLC | 706 | 0,00 | 83 | 60,78 | ||||
| 2026-01-30 | 13F | Us Bancorp \de\ | 18.582 | 182,49 | 2.182 | 359,16 | ||||
| 2026-02-13 | 13F | Verition Fund Management LLC | 40.877 | 869,80 | 4.800 | 1.478,62 | ||||
| 2026-02-17 | 13F | Engineers Gate Manager LP | 14.403 | 1.691 | ||||||
| 2025-12-09 | 13F/A | Tudor Investment Corp Et Al | 0 | -100,00 | 0 | |||||
| 2026-02-17 | 13F | Silvercrest Asset Management Group Llc | 83.387 | -48,59 | 9.791 | -16,51 | ||||
| 2026-02-13 | 13F | Mariner, LLC | 8.152 | -7,52 | 957 | 50,24 | ||||
| 2026-04-13 | 13F | AdviceOne Advisory Services, LLC | 2.000 | 0,00 | 351 | 49,57 | ||||
| 2026-02-09 | 13F | Systematic Financial Management Lp | 650.788 | -13,61 | 76.416 | 40,34 | ||||
| 2026-02-20 | 13F | Ruggaard & Associates LLC | 2.750 | 323 | ||||||
| 2025-11-13 | 13F | Ulland Investment Advisors, LLC | 0 | -100,00 | 0 | |||||
| 2026-04-14 | 13F | USA Financial Portformulas Corp | 182 | -21,21 | 32 | 14,81 | ||||
| 2026-04-16 | 13F | SG Americas Securities, LLC | 486.865 | 85 | ||||||
| 2026-02-10 | 13F | Bank of New York Mellon Corp | 7.972 | -2,16 | 936 | 61,38 | ||||
| 2026-02-04 | 13F | Centric Wealth Management | 2.600 | 356 | ||||||
| 2026-02-13 | 13F | Herald Investment Management Ltd | 180.000 | -9,09 | 21.096 | 47,39 | ||||
| 2026-04-21 | 13F | Ground Swell Capital, LLC | 0 | -100,00 | 0 | |||||
| 2026-01-28 | 13F | Eagle Global Advisors Llc | 60.323 | 0,00 | 7.083 | 62,42 | ||||
| 2026-02-04 | 13F | Katamaran Capital LLP | 26.706 | -63,73 | 3.136 | -41,10 | ||||
| 2026-02-05 | 13F | AlphaCore Capital LLC | 2.731 | -12,52 | 321 | 42,22 | ||||
| 2026-02-17 | 13F | LMR Partners LLP | 230.670 | 59,08 | 27.085 | 158,37 | ||||
| 2026-03-12 | 13F/A | Peak6 Llc | 0 | -100,00 | 0 | -100,00 | ||||
| 2026-04-09 | 13F | Park Place Capital Corp | 89 | -19,09 | 16 | 25,00 | ||||
| 2026-01-29 | 13F | Mivtachim The Workers Social Insurance Fund Ltd. (Under Special Management) | 447.991 | -45,12 | 52.603 | -10,87 | ||||
| 2026-04-23 | 13F | North Star Investment Management Corp. | 10 | 42,86 | 2 | |||||
| 2026-02-17 | 13F | Alta Park Capital, LP | 165.804 | 19.469 | ||||||
| 2026-04-13 | 13F | Creative Financial Designs Inc /adv | 170 | 30 | ||||||
| 2026-02-13 | 13F | Smartleaf Asset Management LLC | 42 | 5 | ||||||
| 2026-02-13 | 13F | Walleye Trading LLC | Put | 445.600 | 11.626,32 | 52.322 | 18.995,62 | |||
| 2026-02-17 | 13F | Nishkama Capital, LLC | 0 | -100,00 | 0 | |||||
| 2026-02-18 | 13F | State of Tennessee, Treasury Department | 185.915 | 86,62 | 25.048 | 247,79 | ||||
| 2026-02-13 | 13F | Walleye Trading LLC | Call | 431.000 | 11.548,65 | 50.608 | 18.854,31 | |||
| 2026-02-17 | 13F | Lazard Asset Management Llc | 21.324 | -1,69 | 2.504 | 59,63 | ||||
| 2026-04-17 | 13F | HHM Wealth Advisors, LLC | 1.700 | 298 | ||||||
| 2026-02-06 | 13F | Gsa Capital Partners Llp | 10.098 | 99,49 | 1 | |||||
| 2026-02-13 | 13F | MAI Capital Management | 131 | 0,00 | 15 | 66,67 | ||||
| 2026-02-13 | 13F | Citigroup Inc | 120.012 | 88,21 | 14.046 | 209,16 | ||||
| 2025-11-14 | 13F | Wolverine Trading, Llc | Call | 55.100 | -12,68 | 3.885 | 41,79 | |||
| 2025-11-14 | 13F | Wolverine Trading, Llc | Put | 30.900 | 89,57 | 2.179 | 208,06 | |||
| 2026-02-12 | 13F | BlackRock, Inc. | 3.907.144 | -6,26 | 458.777 | 52,24 | ||||
| 2026-04-20 | 13F | Assenagon Asset Management S.A. | 113.441 | -73,74 | 19.354 | -61,73 | ||||
| 2026-02-12 | 13F | Renaissance Technologies Llc | 250.549 | -17,32 | 29.419 | 34,27 | ||||
| 2026-04-09 | 13F | Rockingstone Advisors LLC | 33.276 | -26,22 | 5.839 | 10,27 | ||||
| 2026-04-23 | 13F | Forum Financial Management, LP | 0 | -100,00 | 0 | |||||
| 2025-11-14 | 13F | Wolverine Trading, Llc | 43.657 | 236,52 | 3.078 | 446,71 | ||||
| 2026-02-11 | 13F | Parallel Advisors, LLC | 480 | -2,04 | 56 | 60,00 | ||||
| 2026-02-17 | 13F | Janus Henderson Group Plc | 1.074.717 | 293,82 | 126.193 | 539,60 | ||||
| 2026-02-10 | 13F | Bnp Paribas Arbitrage, Sa | 2.505 | -81,28 | 294 | -69,60 | ||||
| 2026-02-13 | 13F | Cramer Rosenthal Mcglynn Llc | 322.606 | 7.471,13 | 37.880 | 12.198,70 | ||||
| 2026-01-29 | 13F | IMC-Chicago, LLC | Put | 131.800 | 165,73 | 15.476 | 331,54 | |||
| 2026-01-29 | 13F | IMC-Chicago, LLC | Call | 283.100 | 93,24 | 33.242 | 213,86 | |||
| 2026-02-17 | 13F | Two Sigma Advisers, Lp | 28.900 | 125,78 | 3.393 | 266,81 | ||||
| 2026-02-05 | 13F | Thrivent Financial For Lutherans | 9.660 | -10,87 | 1 | |||||
| 2026-01-21 | 13F | Y.D. More Investments Ltd | 1.009.846 | 4,60 | 118.084 | 71,75 | ||||
| 2026-02-17 | 13F | Susquehanna Advisors Group, Inc. | 46.422 | 5.451 | ||||||
| 2026-01-30 | 13F | Pekin Hardy Strauss, Inc. | 0 | -100,00 | 0 | |||||
| 2026-02-17 | 13F | Summit Partners Public Asset Management, Llc | 962.458 | -10,22 | 113.012 | 45,81 | ||||
| 2026-01-29 | 13F | WT Asset Management Ltd | 672.515 | 78.967 | ||||||
| 2026-02-17 | 13F | Summit Partners Public Asset Management, Llc | Put | 245.000 | -18,33 | 28.768 | 32,63 | |||
| 2026-02-17 | 13F | Defiance ETFs, LLC | 315.704 | 38.096 | ||||||
| 2026-04-08 | 13F | Wealth Enhancement Advisory Services, Llc | 3.191 | -79,06 | 631 | -66,13 | ||||
| 2026-02-17 | 13F | Cresset Asset Management, LLC | 1.820 | 214 | ||||||
| 2026-02-17 | 13F | Boothbay Fund Management, Llc | 18.218 | -74,52 | 2.139 | -58,61 | ||||
| 2026-02-12 | 13F | Nuveen, LLC | 83.164 | 0,00 | 9.733 | 64,24 | ||||
| 2026-02-09 | 13F | Hartland & Co., LLC | 108 | 8,00 | 13 | 71,43 | ||||
| 2026-02-17 | 13F | D. E. Shaw & Co., Inc. | Call | 9.400 | 1.104 | |||||
| 2026-02-10 | 13F | Td Asset Management Inc | 174.409 | 661,28 | 20.470 | 1.154,23 | ||||
| 2026-02-13 | 13F | Marshall Wace, Llp | 618.515 | 72.626 | ||||||
| 2026-02-17 | 13F | D. E. Shaw & Co., Inc. | 31.067 | 70,25 | 3.648 | 176,50 | ||||
| 2026-02-19 | 13F | Invesco Ltd. | 1.310.276 | -17,94 | 153.853 | 33,26 | ||||
| 2026-02-17 | 13F | Quantinno Capital Management LP | 8.132 | 42,04 | 955 | 130,99 | ||||
| 2026-02-12 | 13F | Menora Mivtachim Holdings Ltd. | 522.592 | -69,32 | 61.363 | -50,17 | ||||
| 2026-02-06 | 13F | Legato Capital Management LLC | 27.318 | 10,02 | 3.208 | 78,66 | ||||
| 2026-02-13 | 13F | American Century Companies Inc | 206.445 | -56,08 | 24.241 | -28,68 | ||||
| 2026-04-23 | 13F | Oppenheimer & Co Inc | 6.228 | 1.093 | ||||||
| 2026-02-12 | 13F | Hollencrest Capital Management | 1.912 | 225 | ||||||
| 2026-01-27 | 13F | WealthCollab, LLC | 523 | -42,46 | 61 | -6,15 | ||||
| 2026-02-06 | 13F | VSM Wealth Advisory, LLC | 400 | 0,00 | 47 | 64,29 | ||||
| 2026-02-13 | 13F | Pinpoint Asset Management (Singapore) Pte. Ltd. | 1.066 | 53.200,00 | 125 | |||||
| 2026-01-09 | 13F | SG Americas Securities, LLC | Call | 0 | -100,00 | 0 | ||||
| 2026-01-21 | 13F | Newbridge Financial Services Group, Inc. | 1.985 | 233 | ||||||
| 2026-04-07 | 13F | CoreCap Advisors, LLC | 250 | -56,52 | 44 | -35,82 | ||||
| 2026-02-12 | 13F | Waters Parkerson & Co., Llc | 23.170 | -49,02 | 2.721 | -17,22 | ||||
| 2026-02-09 | 13F | Legal & General Group Plc | 340.462 | -10,64 | 39.874 | 46,87 | ||||
| 2026-02-10 | 13F | Meitav Dash Investments Ltd | 1.883.775 | -16,96 | 220.836 | 35,59 | ||||
| 2026-02-05 | 13F | Allworth Financial LP | 46 | 17,95 | 5 | 150,00 | ||||
| 2026-02-13 | 13F | Toroso Investments, LLC | 46.956 | -11,62 | 5.514 | 43,53 | ||||
| 2026-02-11 | 13F | Situational Awareness LP | 723.004 | 53,63 | 84.895 | 149,52 | ||||
| 2026-02-13 | 13F | Gendell Jeffrey L | 75.000 | -19,44 | 8.806 | 30,83 | ||||
| 2026-01-12 | 13F | Spinnaker Investment Group, LLC | 0 | -100,00 | 0 | |||||
| 2026-04-17 | 13F | Hanson & Doremus Investment Management | 300 | 0 | ||||||
| 2026-02-17 | 13F | Jump Financial, LLC | 2.850 | 335 | ||||||
| 2026-02-04 | 13F | Dogwood Wealth Management LLC | 16 | 2 | ||||||
| 2025-11-14 | 13F | Atom Investors LP | 0 | -100,00 | 0 | |||||
| 2026-02-17 | 13F | Sphera Funds Management Ltd. | 122.513 | -60,71 | 14.385 | -36,19 | ||||
| 2025-10-30 | 13F | Parkside Financial Bank & Trust | 0 | -100,00 | 0 | |||||
| 2026-02-13 | 13F | Itau Unibanco Holding S.A. | 34.000 | 4.100 | ||||||
| 2026-02-13 | 13F | Sei Investments Co | 150.729 | 111,44 | 17.699 | 243,38 | ||||
| 2026-04-14 | 13F | Thurston, Springer, Miller, Herd & Titak, Inc. | 100 | -33,33 | 18 | 0,00 | ||||
| 2026-02-11 | 13F | Group One Trading, L.p. | 0 | -100,00 | 0 | -100,00 | ||||
| 2026-02-09 | 13F | William Blair Investment Management, Llc | 378.980 | -46,04 | 44.500 | -12,37 | ||||
| 2026-02-17 | 13F | Granahan Investment Management Inc/ma | 0 | -100,00 | 0 | |||||
| 2026-02-12 | 13F | Oak Associates Ltd /oh/ | 12.635 | -37,65 | 1.484 | 148.200,00 | ||||
| 2026-04-21 | 13F | GHP Investment Advisors, Inc. | 22.437 | 0,00 | 3.937 | 49,47 | ||||
| 2026-02-11 | 13F | Commonwealth Retirement Investments LLC | 100 | 12 | ||||||
| 2026-02-04 | 13F | Schwartz Investment Counsel Inc | 260.000 | 0,00 | 30.529 | 62,41 | ||||
| 2025-11-14 | 13F | Twinbeech Capital Lp | 0 | -100,00 | 0 | -100,00 | ||||
| 2026-02-17 | 13F | Armistice Capital, Llc | 23.521 | 2.762 | ||||||
| 2025-11-10 | 13F | Citigroup Inc | Call | 0 | -100,00 | 0 | -100,00 | |||
| 2026-01-30 | 13F | Canandaigua National Bank & Trust Co | 2.209 | 259 | ||||||
| 2026-02-17 | 13F | Voloridge Investment Management, Llc | 58.176 | 82,65 | 6.831 | 196,74 | ||||
| 2026-02-17 | 13F | Canada Pension Plan Investment Board | 342.161 | 32,72 | 40.047 | 118,03 | ||||
| 2026-04-17 | 13F | Bell Investment Advisors, Inc | 49 | -33,78 | 9 | 0,00 | ||||
| 2026-02-10 | 13F | State of Wyoming | 13.054 | -0,33 | 1.533 | 61,95 | ||||
| 2026-02-03 | 13F | Harel Insurance Investments & Financial Services Ltd. | 2.318.130 | 0,00 | 272 | 62,87 | ||||
| 2026-02-17 | 13F | Price T Rowe Associates Inc /md/ | 4.682.152 | 3.222,63 | 550 | 5.390,00 | ||||
| 2026-02-17 | 13F | MIRAE ASSET GLOBAL ETFS HOLDINGS Ltd. | 192 | 22,29 | 22 | 100,00 | ||||
| 2026-02-11 | 13F | Capital International Investors | 1.895.161 | 222.530 | ||||||
| 2026-04-27 | 13F | Truist Financial Corp | 5.429 | -31,43 | 953 | 2,48 | ||||
| 2026-02-17 | 13F | Kultura Capital Management LP | 57.000 | 6.693 | ||||||
| 2026-02-13 | 13F | FORA Capital, LLC | 4.447 | 522 | ||||||
| 2026-04-21 | 13F | Huntleigh Advisors, Inc. | 1.570 | 276 | ||||||
| 2026-01-29 | 13F | UBS Group AG | 368.654 | -31,46 | 43.287 | 11,31 | ||||
| 2026-01-12 | 13F | Rialto Wealth Management, LLC | 78 | 9 | ||||||
| 2026-02-13 | 13F | Morgan Stanley | 642.254 | 45,72 | 75.414 | 136,66 | ||||
| 2026-02-17 | 13F | Sender Co & Partners, Inc. | 0 | -100,00 | 0 | |||||
| 2026-01-14 | 13F | ORG Partners LLC | 14 | 2 | ||||||
| 2026-02-13 | 13F | Arvin Capital Management LP | 44.135 | -74,19 | 5.182 | -58,08 | ||||
| 2026-04-13 | 13F | E Fund Management Co., Ltd. | 347.752 | 61.024 | ||||||
| 2026-02-06 | 13F | EverSource Wealth Advisors, LLC | 481 | -28,32 | 56 | 16,67 | ||||
| 2026-02-17 | 13F | Gilder Gagnon Howe & Co Llc | 471.954 | -2,49 | 55.417 | 58,37 | ||||
| 2025-11-12 | 13F | Transce3nd, LLC | 0 | -100,00 | 0 | |||||
| 2026-04-16 | 13F | Baron Wealth Management LLC | 2.035 | 357 | ||||||
| 2026-02-17 | 13F | Altshuler Shaham Ltd | Call | 18 | 0 | |||||
| 2026-02-17 | 13F | Altshuler Shaham Ltd | 26.645 | 416,08 | 3.116 | 737,37 | ||||
| 2026-04-13 | 13F | Salem Investment Counselors Inc | 75 | 13 | ||||||
| 2026-02-11 | 13F | Simplex Trading, Llc | Call | 50.300 | -30,24 | 5.906 | 118.020,00 | |||
| 2026-02-11 | 13F | Simplex Trading, Llc | Put | 25.900 | 99,23 | 3.041 | ||||
| 2026-02-11 | 13F | Simplex Trading, Llc | 1.696 | 199 | ||||||
| 2026-02-17 | 13F | GAM Holding AG | 13.044 | -17,71 | 1.532 | 33,60 | ||||
| 2025-11-21 | 13F | Nebula Research & Development LLC | 0 | -100,00 | 0 | -100,00 | ||||
| 2026-01-22 | 13F | Evermay Wealth Management Llc | 500 | 0,00 | 59 | 61,11 | ||||
| 2026-04-15 | 13F | Activest Wealth Management | 0 | 0 | ||||||
| 2026-02-05 | 13F | Phoenix Holdings Ltd. | Call | 0 | -100,00 | 0 | -100,00 | |||
| 2026-02-17 | 13F | Balyasny Asset Management Llc | 372.713 | -16,21 | 43.764 | 36,08 | ||||
| 2026-02-11 | 13F | Neumeier Poma Investment Counsel Llc | 457.288 | -41,48 | 53.695 | -4,95 | ||||
| 2026-04-20 | 13F | Kestra Private Wealth Services, Llc | 0 | -100,00 | 0 | |||||
| 2026-02-03 | 13F | Pier Capital, LLC | 67.520 | 31,35 | 7.928 | 113,35 | ||||
| 2026-02-12 | 13F | Brinker Capital Investments, LLC | 21.768 | -16,52 | 2.556 | 35,54 | ||||
| 2026-02-17 | 13F | Bedell Frazier Investment Counseling, LLC | 2.700 | 317 | ||||||
| 2026-04-22 | 13F | Gunderson Capital Management Inc. | 26.219 | 4.601 | ||||||
| 2026-04-07 | 13F | Central Pacific Bank - Trust Division | 0 | -100,00 | 0 | |||||
| 2026-02-09 | 13F | Royce & Associates Lp | 110.658 | -1,56 | 12.993 | 59,87 | ||||
| 2026-02-17 | 13F | Bank Of America Corp /de/ | 925.027 | -3,41 | 108.617 | 56,88 | ||||
| 2026-03-06 | 13F | Hsbc Holdings Plc | 0 | -100,00 | 0 | |||||
| 2026-04-20 | 13F | Friedenthal Financial | 4 | 1 | ||||||
| 2026-02-13 | 13F | Analog Century Management LP | 811.470 | -12,29 | 95.283 | 42,44 | ||||
| 2026-02-13 | 13F | Arrowstreet Capital, Limited Partnership | 226.560 | 34,07 | 26.586 | 117,98 | ||||
| 2026-02-23 | 13F | Virtu Financial LLC | 18.594 | 2 | ||||||
| 2026-02-13 | 13F | Manufacturers Life Insurance Company, The | 0 | -100,00 | 0 | |||||
| 2026-02-17 | 13F | KP Management LLC | 61.035 | 0,00 | 7.167 | 62,42 | ||||
| 2026-02-04 | 13F | KLCM Advisors, Inc. | 2.000 | 235 | ||||||
| 2026-04-17 | 13F | Tectonic Advisors Llc | 10.751 | 4,51 | 1.887 | 56,26 | ||||
| 2026-02-13 | 13F | Truvestments Capital Llc | 77 | 0,00 | 9 | 80,00 | ||||
| 2026-02-11 | 13F | Kranot Hishtalmut Le Morim Ve Gananot Havera Menahelet LTD | 0 | -100,00 | 0 | |||||
| 2026-01-28 | 13F | Migdal Insurance & Financial Holdings Ltd. | 3.002.806 | 0,84 | 353 | 63,72 | ||||
| 2025-11-14 | 13F | Caption Management, LLC | Call | 0 | -100,00 | 0 | -100,00 | |||
| 2026-02-17 | 13F | G2 Investment Partners Management LLC | 74.000 | -74,48 | 8.689 | -58,55 | ||||
| 2025-11-14 | 13F | Caption Management, LLC | 0 | -100,00 | 0 | -100,00 | ||||
| 2026-02-17 | 13F | Raymond James Financial Inc | 51.056 | 64,90 | 5.995 | 167,83 | ||||
| 2026-04-16 | 13F | Park National Corp /oh/ | 1.318 | 231 | ||||||
| 2026-04-24 | 13F | Private Advisor Group, LLC | 20.342 | 3.570 | ||||||
| 2026-02-17 | 13F | Fmr Llc | 692 | -5,46 | 81 | 58,82 | ||||
| 2026-02-12 | 13F | Turiya Advisors Asia Ltd | 1.472.045 | 172.848 | ||||||
| 2026-02-05 | 13F | Cambridge Investment Research Advisors, Inc. | 1.860 | 0 | ||||||
| 2026-02-12 | 13F | Senvest Management, LLC | 3.971.656 | -29,10 | 466.352 | 15,14 | ||||
| 2026-02-17 | 13F | XTX Topco Ltd | 7.183 | 843 | ||||||
| 2025-11-13 | 13F | Magnetar Financial LLC | 0 | -100,00 | 0 | |||||
| 2026-02-02 | 13F | CENTRAL TRUST Co | 0 | -100,00 | 0 | |||||
| 2026-02-17 | 13F | SIH Partners, LLLP | 139.623 | 16.395 | ||||||
| 2026-02-12 | 13F | Brown Brothers Harriman & Co | 88 | 10 | ||||||
| 2026-02-17 | 13F | Creative Planning | 11.559 | -0,54 | 1.357 | 61,55 | ||||
| 2026-01-26 | 13F | Private Trust Co Na | 132 | 15 | ||||||
| 2026-02-17 | 13F | Shellback Capital, LP | 25.000 | 9,87 | 2.936 | 78,42 | ||||
| 2026-04-15 | 13F | Gf Fund Management Co. Ltd. | 1.144.395 | 271,06 | 200.818 | 454,55 | ||||
| 2026-02-09 | 13F | Wcm Investment Management, Llc | 185.982 | 125,96 | 22.442 | 286,73 | ||||
| 2026-02-18 | 13F | Mackenzie Financial Corp | 5.283 | 4,55 | 653 | 81,89 | ||||
| 2026-02-17 | 13F | Ameriprise Financial Inc | 182.585 | 78,20 | 21.439 | 189,44 | ||||
| 2026-01-30 | 13F | Jennison Associates Llc | 1.398.987 | -40,00 | 164.269 | -2,56 | ||||
| 2026-02-17 | 13F | Russell Investments Group, Ltd. | 66.870 | -32,39 | 7.855 | 9,85 | ||||
| 2026-01-13 | 13F | Stephens Consulting, LLC | 100 | 0,00 | 12 | 57,14 | ||||
| 2026-02-09 | 13F | HBK Sorce Advisory LLC | 2.656 | -11,97 | 369 | 65,47 | ||||
| 2026-01-30 | 13F | Citizens National Bank Trust Department | 1.200 | 0,00 | 140 | 64,71 | ||||
| 2026-02-11 | 13F | Havemeyer Place LP | 8.122 | 954 | ||||||
| 2026-02-12 | 13F | Callan Family Office, LLC | 8.448 | 21,64 | 992 | 97,41 | ||||
| 2026-04-22 | 13F | Atlantic Edge Private Wealth Management, LLC | 396 | 69 | ||||||
| 2026-04-16 | 13F | Brookstone Capital Management | 2.002 | 351 | ||||||
| 2026-04-21 | 13F | Mesirow Financial Investment Management, Inc. | 1.885 | 0,00 | 331 | 49,32 | ||||
| 2026-02-17 | 13F | Scientech Research LLC | 1.970 | 231 | ||||||
| 2026-02-11 | 13F | Deutsche Bank Ag\ | 28.125 | 33,90 | 3.302 | 117,52 | ||||
| 2026-02-09 | 13F | Huntington National Bank | 57 | -60,96 | 7 | -40,00 | ||||
| 2026-02-10 | 13F | Envestnet Asset Management Inc | 30.820 | -42,33 | 3.619 | -6,34 | ||||
| 2026-02-12 | 13F | Counterpoint Mutual Funds LLC | 24.267 | 62,81 | 2.849 | 164,53 | ||||
| 2026-04-27 | 13F | Td Private Client Wealth Llc | 468 | -54,16 | 82 | -31,09 | ||||
| 2026-02-17 | 13F | Citadel Advisors Llc | Put | 255.400 | 155,91 | 29.989 | 315,65 | |||
| 2026-02-17 | 13F | Citadel Advisors Llc | 61.899 | -59,57 | 7.268 | -34,35 | ||||
| 2026-04-24 | 13F | Keybank National Association/oh | 5.597 | -41,39 | 982 | -12,40 | ||||
| 2026-02-17 | 13F | Citadel Advisors Llc | Call | 323.100 | 112,71 | 37.938 | 245,46 | |||
| 2026-02-13 | 13F | Neuberger Berman Group LLC | 273.144 | -32,46 | 32.073 | 9,69 | ||||
| 2026-04-20 | 13F | Ronald Blue Trust, Inc. | 356 | -59,31 | 62 | -39,22 | ||||
| 2026-02-13 | 13F | Victory Capital Management Inc | 204.625 | -85,56 | 24.027 | -76,55 | ||||
| 2026-02-17 | 13F | Edmond De Rothschild Holding S.a. | 605 | 0,00 | 71 | 62,79 | ||||
| 2026-02-12 | 13F | Quadrant Capital Group Llc | 1.735 | 0,46 | 204 | 63,71 | ||||
| 2026-02-12 | 13F | EHP Funds Inc. | 0 | -100,00 | 0 | |||||
| 2026-02-17 | 13F | Hood River Capital Management LLC | 393.992 | -73,92 | 46.263 | -57,64 | ||||
| 2026-02-13 | 13F | Kestra Advisory Services, LLC | 444 | 52 | ||||||
| 2026-02-14 | 13F | Rockefeller Capital Management L.P. | 7.208 | 66,81 | 847 | 171,15 | ||||
| 2026-02-03 | 13F | SBI Securities Co., Ltd. | 520 | 344,44 | 61 | 662,50 | ||||
| 2026-04-15 | 13F | FNY Investment Advisers, LLC | 300 | 0 | ||||||
| 2026-01-26 | 13F | Taylor Frigon Capital Management LLC | 29.758 | -45,92 | 3.494 | -12,17 | ||||
| 2026-04-16 | 13F | Thompson Davis & Co., Inc. | 0 | -100,00 | 0 | |||||
| 2026-02-13 | 13F | Ubs Oconnor Llc | 0 | -100,00 | 0 | |||||
| 2025-11-14 | 13F | Ubs Asset Management Americas Inc | 0 | -100,00 | 0 | -100,00 | ||||
| 2026-02-02 | 13F | Wolverine Asset Management Llc | 4.357 | 0,00 | 512 | 62,22 | ||||
| 2026-02-06 | 13F | Global Retirement Partners, LLC | 2.068 | 1.420,59 | 243 | 2.588,89 | ||||
| 2025-11-14 | 13F | Quarry LP | 0 | -100,00 | 0 | |||||
| 2026-02-13 | 13F | Essex Investment Management Co Llc | 192.628 | -1,89 | 22.618 | 59,34 | ||||
| 2026-02-13 | 13F | State Street Corp | 46.969 | -46,66 | 5.515 | -13,37 | ||||
| 2026-02-02 | 13F | Fifth Third Bancorp | 2.823 | -64,77 | 331 | -42,83 | ||||
| 2026-02-11 | 13F | Fosun International Ltd | 5.000 | 587 | ||||||
| 2026-02-17 | 13F | Public Employees Retirement System Of Ohio | 62.164 | 19,13 | 7.285 | 95,96 | ||||
| 2026-01-29 | 13F | Cornerstone Investment Partners, LLC | 0 | -100,00 | 0 | |||||
| 2026-02-17 | 13F | Advisory Services Network, LLC | 0 | -100,00 | 0 | |||||
| 2025-11-12 | 13F | Arvin Capital Management LP | Call | 0 | -100,00 | 0 | -100,00 | |||
| 2026-01-26 | 13F | Cwm, Llc | 6 | 0 | ||||||
| 2026-02-11 | 13F | Hodges Capital Management Inc. | 64.794 | 7.608 | ||||||
| 2026-01-21 | 13F | Crews Bank & Trust | 2.600 | 0,00 | 305 | 63,10 | ||||
| 2025-11-14 | 13F | Point72 Asia (Singapore) Pte. Ltd. | 30.725 | 2.221 | ||||||
| 2026-04-22 | 13F | Harbor Asset Planning, Inc. | 141 | 0,00 | 25 | 50,00 | ||||
| 2026-03-12 | 13F/A | Peak6 Llc | Put | 200 | 23 | |||||
| 2026-03-12 | 13F/A | Peak6 Llc | Call | 122.900 | -19,57 | 14.431 | 30,62 | |||
| 2026-02-13 | 13F | Rokos Capital Management LLP | 204.365 | 23.989 | ||||||
| 2026-02-17 | 13F | Two Sigma Investments, Lp | 102.405 | 12.024 | ||||||
| 2026-02-05 | 13F | Phoenix Holdings Ltd. | 3.829.537 | -1,04 | 449.664 | 60,72 | ||||
| 2026-04-23 | 13F | SJS Investment Consulting Inc. | 32 | 6 | ||||||
| 2026-01-29 | 13F | Verdence Capital Advisors LLC | 8.920 | -30,49 | 1.047 | 3,36 | ||||
| 2026-02-12 | 13F | EAM Global Investors LLC | 24.724 | -48,25 | 2.903 | -15,95 | ||||
| 2026-01-20 | 13F | Harbor Capital Advisors, Inc. | 3.806 | -76,45 | 0 | -100,00 | ||||
| 2026-02-09 | 13F | Prospera Financial Services Inc | 0 | -100,00 | 0 | |||||
| 2026-02-13 | 13F | National Bank Of Canada /fi/ | 190 | -65,77 | 22 | -43,59 | ||||
| 2026-02-17 | 13F | Two Sigma Investments, Lp | Put | 3.000 | 352 | |||||
| 2026-02-17 | 13F | Advisor Group Holdings, Inc. | 31.004 | 1.050,00 | 3.640 | 2.119,51 | ||||
| 2026-02-12 | 13F | CIBC Private Wealth Group, LLC | 441 | 5,50 | 52 | 70,00 | ||||
| 2026-02-17 | 13F | Two Sigma Investments, Lp | Call | 6.000 | 705 | |||||
| 2026-02-24 | 13F | DGS Capital Management, LLC | 15.959 | -3,03 | 1.874 | 57,53 | ||||
| 2026-04-07 | 13F | Signaturefd, Llc | 2.777 | 13,76 | 487 | 70,28 | ||||
| 2026-02-18 | 13F | GWM Advisors LLC | 430 | -64,61 | 50 | -42,53 | ||||
| 2026-02-10 | 13F | Acadian Asset Management Llc | 596.328 | 66.454,46 | 70 | |||||
| 2026-02-17 | 13F | T. Rowe Price Investment Management, Inc. | 3.102 | 0 | ||||||
| 2025-11-04 | 13F | Guerra Advisors Inc | 58 | 4 | ||||||
| 2026-02-17 | 13F | Benchstone Capital Management LP | 96.225 | -59,63 | 11.299 | -34,43 | ||||
| 2026-02-17 | 13F | Capital Fund Management S.a. | 10.907 | 1.281 | ||||||
| 2026-02-12 | 13F | Hrt Financial Lp | 35.239 | 4 | ||||||
| 2026-02-17 | 13F | Point72 Asset Management, L.P. | Put | 26.300 | 3.088 | |||||
| 2026-02-13 | 13F | Greenline Wealth Management LLC | 4 | 0 | ||||||
| 2026-02-17 | 13F | Point72 Asset Management, L.P. | 1.613.540 | -42,86 | 189.462 | -7,19 | ||||
| 2026-02-17 | 13F | Point72 Asset Management, L.P. | Call | 36.100 | 4.239 | |||||
| 2026-02-10 | 13F | Commonwealth Of Pennsylvania Public School Empls Retrmt Sys | 5.268 | 619 | ||||||
| 2026-02-17 | 13F | Garden State Investment Advisory Services LLC | 7.828 | -4,80 | 919 | 54,71 | ||||
| 2026-02-13 | 13F | Squarepoint Ops LLC | Call | 25.300 | 2.971 | |||||
| 2026-02-13 | 13F | Squarepoint Ops LLC | Put | 22.200 | 2.607 | |||||
| 2026-02-06 | 13F | Larson Financial Group LLC | 334 | -26,43 | 39 | 21,88 | ||||
| 2026-02-13 | 13F | Squarepoint Ops LLC | 32.938 | 3.868 | ||||||
| 2026-02-05 | 13F | GABELLI & Co INVESTMENT ADVISERS, INC. | 2.000 | 235 | ||||||
| 2026-02-13 | 13F | Transamerica Financial Advisors, Inc. | 15 | 2 | ||||||
| 2026-01-14 | 13F | ORG Wealth Partners, LLC | 0 | -100,00 | 0 | |||||
| 2026-02-12 | 13F | Aviva Plc | 1.816 | 213 | ||||||
| 2026-04-22 | 13F | Pictet Asset Management Holding SA | 46.385 | 70,85 | 7.914 | 149,07 | ||||
| 2026-01-14 | 13F | Hunter Perkins Capital Management, LLC | 15.780 | -29,99 | 2 | 0,00 | ||||
| 2026-04-24 | 13F | Key FInancial Inc | 100 | 0,00 | 18 | 54,55 | ||||
| 2026-02-17 | 13F | Capital Fund Management S.a. | Call | 28.500 | 103,57 | 3.346 | 230,63 | |||
| 2025-11-14 | 13F | Cubist Systematic Strategies, LLC | 0 | -100,00 | 0 | -100,00 | ||||
| 2026-02-12 | 13F | Bank Of Montreal /can/ | Put | 21.000 | 0,00 | 2.466 | 62,38 | |||
| 2026-02-17 | 13F | Capital Fund Management S.a. | Put | 11.900 | -26,99 | 1.397 | 18,59 | |||
| 2026-02-12 | 13F | Bank Of Montreal /can/ | 22.794 | 3,07 | 2.676 | 67,46 | ||||
| 2026-02-17 | 13F | Portolan Capital Management, LLC | 148.525 | -54,62 | 17.440 | -26,31 | ||||
| 2026-02-17 | 13F | Tower Research Capital LLC (TRC) | 1.246 | 181,26 | 146 | 356,25 | ||||
| 2026-01-29 | 13F | Calamos Advisors LLC | 24.743 | 156,03 | 2.905 | 316,19 | ||||
| 2026-02-10 | 13F/A | Northwestern Mutual Wealth Management Co | 15 | 2 | ||||||
| 2026-01-29 | 13F | Rakuten Securities, Inc. | 71 | 8 | ||||||
| 2026-04-20 | 13F | Jfs Wealth Advisors, Llc | 103 | 0,00 | 18 | 50,00 | ||||
| 2026-02-13 | 13F | Walleye Capital LLC | Call | 4.100 | 481 | |||||
| 2026-02-13 | 13F | Walleye Capital LLC | Put | 15.900 | 1.867 | |||||
| 2026-04-07 | 13F | Farther Finance Advisors, LLC | 688 | 5,04 | 129 | 68,42 | ||||
| 2026-02-13 | 13F | Wells Fargo & Company/mn | 7.848 | 2,86 | 922 | 67,15 | ||||
| 2026-04-22 | 13F | Janney Montgomery Scott LLC | 2.147 | -47,45 | 0 | |||||
| 2026-02-13 | 13F | Walleye Capital LLC | 32.286 | 5,07 | 3.791 | 70,69 | ||||
| 2026-02-17 | 13F | Wellington Management Group Llp | 1.351.212 | -35,90 | 158.659 | 4,10 | ||||
| 2026-02-17 | 13F | Clear Street Markets Llc | 20.428 | 2.399 | ||||||
| 2025-11-17 | 13F | PharVision Advisers, LLC | 0 | -100,00 | 0 | |||||
| 2026-02-11 | 13F | Kranot Hishtalmut Le Morim Tichoniim Havera Menahelet LTD | 0 | -100,00 | 0 | |||||
| 2026-02-13 | 13F | K2 Principal Fund, L.p. | 7.411 | -45,15 | 870 | -10,86 | ||||
| 2026-02-05 | 13F | Bessemer Group Inc | 137 | 0,00 | 0 | |||||
| 2026-01-23 | 13F | Cambiar Investors Llc | 49.864 | 60,72 | 5.855 | 161,03 | ||||
| 2026-03-03 | 13F/A | Caitong International Asset Management Co., Ltd | 876 | 103 | ||||||
| 2026-02-11 | 13F | LPL Financial LLC | 21.080 | 186,80 | 2.475 | 366,10 | ||||
| 2026-04-13 | 13F | Hm Payson & Co | 0 | -100,00 | 0 | |||||
| 2026-02-13 | 13F | Centiva Capital, LP | 0 | -100,00 | 0 | |||||
| 2026-02-10 | 13F | Norges Bank | 368.669 | 43.224 | ||||||
| 2026-02-13 | 13F | Clal Insurance Enterprises Holdings Ltd | 4.822.838 | -10,61 | 565 | 46,11 | ||||
| 2026-02-13 | 13F | Walleye Trading LLC | 0 | -100,00 | 0 | -100,00 | ||||
| 2026-04-06 | 13F | Versant Capital Management, Inc | 238 | 3.866,67 | 42 | |||||
| 2026-02-12 | 13F | Wealthspire Advisors, LLC | 0 | -100,00 | 0 | |||||
| 2026-02-17 | 13F | Ameriprise Financial Inc | Put | 0 | -100,00 | 0 | ||||
| 2026-02-14 | 13F | Shannon River Fund Management LLC | 602.804 | -37,34 | 70.781 | 1,76 | ||||
| 2026-02-17 | 13F | Alliancebernstein L.p. | 171.547 | 497,50 | 20.143 | 870,75 | ||||
| 2026-02-13 | 13F | Pinnacle Wealth Planning Services, Inc. | 365 | 43 | ||||||
| 2026-02-12 | 13F | Federation des caisses Desjardins du Quebec | 1.061 | -7,74 | 125 | 49,40 | ||||
| 2026-02-12 | 13F | New York State Common Retirement Fund | 32.558 | -26,30 | 3.823 | 19,70 | ||||
| 2026-01-12 | 13F | CVA Family Office, LLC | 1.500 | 0,00 | 176 | 62,96 | ||||
| 2026-02-17 | 13F | Cetera Investment Advisers | 4.836 | 10,92 | 568 | 80,00 | ||||
| 2026-02-17 | 13F | Susquehanna International Group, Llp | 21.793 | 2.559 | ||||||
| 2026-02-09 | 13F | King Luther Capital Management Corp | 261.466 | -9,32 | 30.701 | 47,27 | ||||
| 2026-02-17 | 13F | Susquehanna International Group, Llp | Put | 316.500 | 306,29 | 37.163 | 559,85 | |||
| 2026-02-17 | 13F | Susquehanna International Group, Llp | Call | 924.500 | 149,26 | 108.555 | 304,81 | |||
| 2026-04-23 | 13F | RIA Advisory Group LLC | 2.499 | 439 | ||||||
| 2026-02-12 | 13F | Jane Street Group, Llc | Put | 134.400 | 9,09 | 15.781 | 77,18 | |||
| 2025-11-14 | 13F | Petrus Trust Company, LTA | 0 | -100,00 | 0 | -100,00 | ||||
| 2026-02-12 | 13F | Jane Street Group, Llc | Call | 393.800 | 25,98 | 46.240 | 104,60 | |||
| 2026-02-12 | 13F | Jane Street Group, Llc | 877.480 | 190,36 | 103.034 | 371,57 | ||||
| 2025-11-14 | 13F | Texas Permanent School Fund | 0 | -100,00 | 0 | |||||
| 2026-04-20 | 13F | Banque Cantonale Vaudoise | 4.407 | -2,52 | 773 | 45,57 | ||||
| 2026-02-17 | 13F | PointState Capital LP | 480.614 | 69,53 | 56.434 | 175,32 | ||||
| 2026-02-06 | 13F | Covestor Ltd | 793 | 10,75 | 0 | |||||
| 2026-04-13 | 13F | IFP Advisors, Inc | 70 | 12 | ||||||
| 2026-02-11 | 13F | Renaissance Group Llc | 62.928 | -56,61 | 7.389 | -29,52 | ||||
| 2026-02-13 | 13F | Virtus ETF Advisers LLC | 14.929 | -28,16 | 1.753 | 16,64 | ||||
| 2026-01-27 | 13F | Evergreen Capital Management Llc | 5.118 | 2,63 | 601 | 66,67 | ||||
| 2026-01-27 | 13F | Zurcher Kantonalbank (Zurich Cantonalbank) | 41.768 | 44,54 | 4.904 | 134,75 | ||||
| 2026-02-11 | 13F | Fox Run Management, L.l.c. | 11.192 | 1.314 | ||||||
| 2026-02-13 | 13F | Wexford Capital Lp | 0 | -100,00 | 0 | -100,00 | ||||
| 2026-02-05 | 13F | Bank Julius Baer & Co. Ltd, Zurich | 113.707 | -8,96 | 13.566 | 50,23 | ||||
| 2026-03-30 | 13F/A | Barclays Plc | Put | 0 | -100,00 | 0 | -100,00 | |||
| 2026-01-23 | 13F | Westside Investment Management, Inc. | 452 | 0,00 | 55 | 66,67 | ||||
| 2026-02-03 | 13F | RWM Asset Management, LLC | 2.000 | 254 | ||||||
| 2025-11-14 | 13F | Integrated Wealth Concepts LLC | 0 | -100,00 | 0 | |||||
| 2026-02-17 | 13F | Polymer Capital Management (US) LLC | 43.272 | -10,96 | 5.081 | 44,61 | ||||
| 2026-02-10 | 13F | Andar Capital Management HK Ltd | 90.250 | 114,88 | 10.597 | 249,04 | ||||
| 2026-04-02 | 13F | Silverleafe Capital Partners, LLC | 2.776 | 487 | ||||||
| 2026-02-11 | 13F | Harvest Fund Management Co., Ltd | 18.866 | 102,79 | 2 | |||||
| 2026-02-12 | 13F | Voya Investment Management Llc | 472.697 | -54,29 | 55.504 | -25,77 | ||||
| 2026-02-11 | 13F | CSM Advisors, LLC | 3.199 | -70,90 | 0 | |||||
| 2026-02-17 | 13F | Park West Asset Management LLC | 355.304 | -39,78 | 41.720 | -2,20 | ||||
| 2026-02-17 | 13F | Royal Bank Of Canada | 5.399 | -57,32 | 635 | -30,60 | ||||
| 2026-02-13 | 13F | Tairen Capital Ltd | 90.000 | 10.568 | ||||||
| 2026-02-13 | 13F | Cornerstone Financial Management LLC | 22 | 3 | ||||||
| 2026-01-29 | 13F | IMC-Chicago, LLC | 0 | -100,00 | 0 | -100,00 | ||||
| 2026-01-29 | 13F | Quent Capital, LLC | 11.000 | 1.292 | ||||||
| 2026-02-10 | 13F | CIBC World Markets Inc. | 2.460 | 289 | ||||||
| 2026-02-11 | 13F | Barrow Hanley Mewhinney & Strauss Llc | 846.953 | -36,71 | 99.449 | 2,79 | ||||
| 2026-04-27 | 13F | Albion Financial Group /ut | 1.017 | 178 | ||||||
| 2026-02-12 | 13F | Skopos Labs, Inc. | 2.706 | 328 | ||||||
| 2026-04-13 | 13F | Massmutual Trust Co Fsb/adv | 17 | 3 | ||||||
| 2026-02-12 | 13F | Yahav Achim Ve Achayot - Provident Funds Management Co Ltd. | 27.858 | 132,15 | 3.271 | 278,15 | ||||
| 2026-02-17 | 13F | Qube Research & Technologies Ltd | 219.825 | 99,89 | 25.812 | 224,67 | ||||
| 2026-04-08 | 13F | E Fund Management (Hong Kong) Co., Ltd. | 2.371 | 416 | ||||||
| 2026-02-17 | 13F | Millennium Management Llc | Call | 22.100 | -22,46 | 2.595 | 25,92 | |||
| 2026-04-16 | 13F | Toth Financial Advisory Corp | 8 | 1 | ||||||
| 2026-02-17 | 13F | Millennium Management Llc | 799.272 | 50,46 | 93.851 | 144,35 | ||||
| 2026-02-17 | 13F | Parallax Volatility Advisers, L.P. | Call | 50.000 | -64,91 | 5.871 | -43,01 | |||
| 2026-02-17 | 13F | Millennium Management Llc | Put | 8.700 | -71,10 | 1.022 | -53,08 | |||
| 2025-11-07 | 13F | State of New Jersey Common Pension Fund D | 0 | -100,00 | 0 | -100,00 | ||||
| 2025-11-05 | 13F | MCF Advisors LLC | 0 | -100,00 | 0 | |||||
| 2026-04-24 | 13F | USS Investment Management Ltd | 33.584 | 6,90 | 573.075 | 55,85 | ||||
| 2026-02-12 | 13F | Penserra Capital Management LLC | 315.704 | -53,00 | 37 | -22,92 | ||||
| 2026-04-10 | 13F | Armstrong Advisory Group, Inc | 90 | 0,00 | 16 | 50,00 | ||||
| 2026-02-13 | 13F | Van Eck Associates Corp | 25.719 | -5,64 | 3 | 200,00 | ||||
| 2026-04-21 | 13F | Vise Technologies, Inc. | 3.265 | 0,00 | 383 | 0,00 | ||||
| 2026-02-12 | 13F | Swiss National Bank | 223.011 | 2,36 | 26.125 | 68,45 | ||||
| 2026-02-17 | 13F | Schonfeld Strategic Advisors LLC | 265.277 | -62,26 | 31.149 | -38,72 | ||||
| 2026-01-30 | 13F | Rachor Investment Advisory Services, LLC | 21 | 2 | ||||||
| 2026-02-17 | 13F | Nomura Holdings Inc | 13.706 | 273,46 | 1.609 | 507,17 | ||||
| 2026-02-17 | 13F | Nomura Holdings Inc | Call | 110.000 | 0,00 | 12.916 | 62,40 | |||
| 2026-04-21 | 13F | Financial Consulate, Inc | 17 | 3 | ||||||
| 2026-02-13 | 13F | Barclays Plc | 22.416 | 150,60 | 2.632 | 307,43 | ||||
| 2026-01-23 | 13F | Lester Murray Antman dba SimplyRich | 2.565 | 0 |